
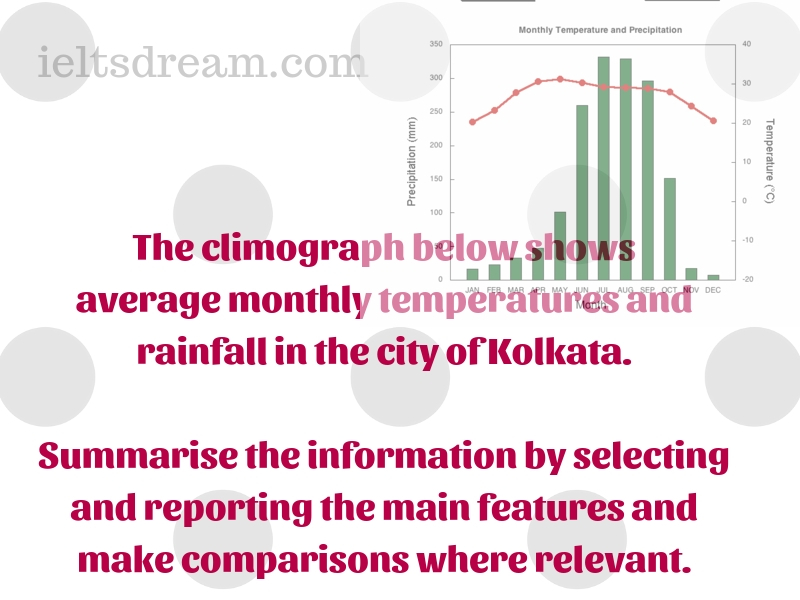
The climograph below shows average monthly temperatures and rainfall in the city of Kolkata.
The climograph below shows average monthly temperatures and rainfall in the city of Kolkata. Summarise the information by selecting and reporting the main features and make comparisons Read More