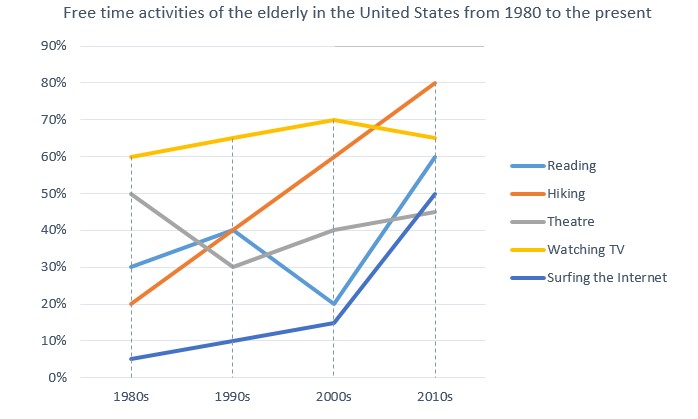
The graph below shows how elderly people in the United States spent their free time between 1980 and 2010. Summarise the information by selecting and reporting the main features, and make comparisons where relevant.
The line graph illustrates the comparison of the proportion of various leisure activities carried out by older adults in the USA from 1980 to 2010. The units are expressed in percentage.
Overall, it is clearly evident that senior citizens had spent the majority of their free time watching Television and visiting Theatre, but both witnessed a decline at the end of the time frame. Conversely, surfing the internet and Hiking was the relatively least performed tasks. However, they got significantly increased at the end of the third decade.
Firstly, In 1980, watching TV shared the highest proportion at around 60%, then this got gradually raised up to 70% by 2000. However, within a decade, it dipped into just over 60%. Likewise, entertainment in movie centres, which accounted for nearly half of the proportion in 1980, and figured a downward trend on 1990, soared to more than 40% by 2010.
Nevertheless, Hiking and reading had the proportion of 20% and 30% in 1980, and both increased up to 40% within the next ten years. Anyway, Hiking figured a steady leap and reading got wide fluctuation and at last former reached 30%, and later got doubled when compared to its initial level. Finally, surfing the internet category got rocketed from 5% to 50% within three decades.
Follow Us Our Facebook Page For Updates related to IELTS material


Leave a Reply