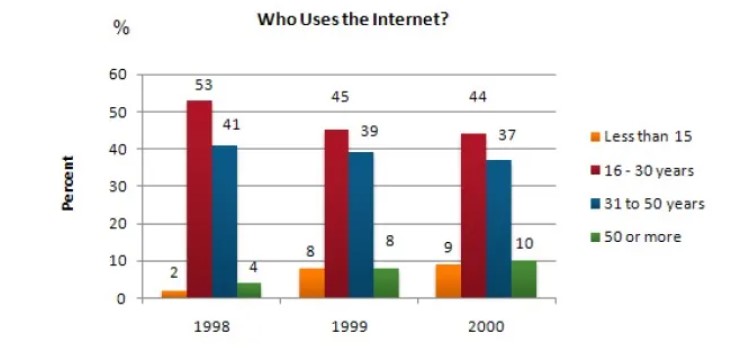
The graph shows Internet Usage in Taiwan by Age Group, 1998-2000. Summarise the information by selecting and reporting the main features, and make comparisons where relevant.
The bar chart illustrates the information regarding the different age groups who utilised the world’s vast network from 1998 to 2000. The data has been calibrated in percentile.
Looking at the overall perspective, it is apparent that the adult shared by the upward trend in the initial year, whereas older people showed the least context.
Apparently, it is crystal noticeable that in 1998 the internet users percentage rose sharply it shows the upward trend compared to others. Then in 31to 50 years, people per centum was approximately more than one fourth. After that, in 2000, the older individuals’ internet usage was almost one-tenth.
Turning towards remaining data, in the second and last year, the per cent of younger people were sharded by the minor difference, approximately near a half. Apart from this, the pupil’s utilisation of the internet was minimum which was only 2% in the given period. In contrast, the per centum of younger people was increased by 8% rather than other.
Follow Us Our Facebook Page For Updates related to IELTS material


Leave a Reply