The bar chart below gives information about vehicle ownership in China.
Write a report for a university lecturer describing the information.
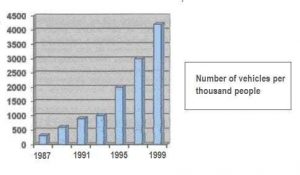
The provide bar graph illustrates about motor vehicle possessions in China from 1987 to 1999. The provide bar graph illustrates about motor vehicle possessions in China from 1987 to 1999
To begin in China, during 1987 three hundred thousand motor vehicles were owned by persons according to a number of vehicle per thousand people. In the following three years, vehicle ownership was about 1000 number of vehicle per thousand people.
In the year 1995, vehicle possessions were increased up to 2000 motor vehicles per thousand people. Then, till the following four years, vehicle ownership was reached to its peak. According to its apex, about 4300. Vehicles were owned by human beings as per thousand people in China.
Overall, it is immediately apparent from the bar graph that in the earlier years, not so much people had motor vehicle possessions but with passing a time vehicle ownership was climbed to the highest position in a number of vehicle per thousand people in China.
Write a report for a university lecturer describing the information.
https://www.facebook.com/Ieltsdreamworld/
The bar chart below gives information about vehicle ownership in China. The bar chart below gives information about vehicle ownership in China. The bar chart below gives information about vehicle ownership in China. information about vehicle information about vehicle information about vehicle information about a vehicle
like and share facebook page


Leave a Reply