
")
The chart below shows the number of men and women in further education in Britain in three periods and whether they were studying full-time or part-time. Summarise the information by selecting and reporting the main features, and make comparisons where relevant.
 Sample Answer of The Chart Below Shows the Number of Men and Women in Further Education in Britain in Three Periods
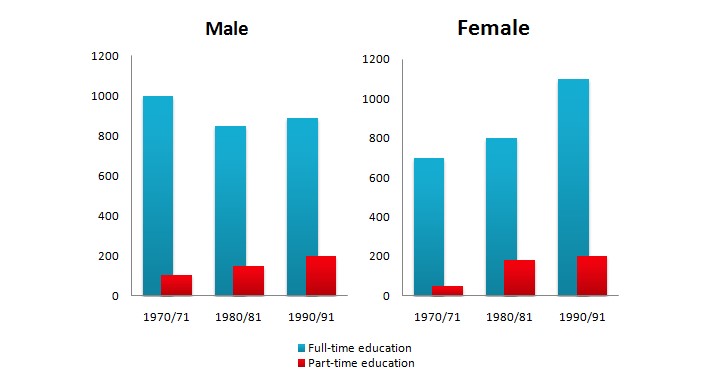
The bar graph indicates how men and women in Britain were enrolled in tertiary education in three periods- 1970/71,1980/81 and 1990/91 and whether their studies were full or part-time.
Overall, it can be seen that more men and women are studying full-time than part-time. However, while the number of females studying all types, of course, increased significantly over the periods shown, the males studying full-time decreased moderately.
While the number of male students who did full-time education was fluctuating, the volume of female students who did the same is seen increasing over this period. In the case of men, the figures fluctuated between 800 and 1000, whereas in the case of women, it grew from around 700 to nearly 1100 from the years 1970/71 to 1990/91.
In the part-time education, the male showed consistent growth in their number over the period, and this is from approximately 100 to around 200 in the years given. In comparison to this, the counterparts number rose between 1970-71 and1980-81 from 50 to around 200 and this growth is seen almost arrested between 1980-81 and 1990-91.
Follow Us Our Facebook Page For Updates related to IELTS material
Leave a Reply