

The chart below shows the results of a survey of people who visited four types of tourist attraction in Britain in the year 1999.
Summarise the information by selecting and reporting the main features and make comparisons where relevant
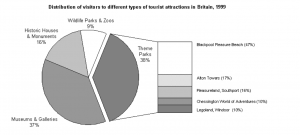
The Pie chart compares the visiting of distinct visitors who came to different attractive places in Britain during 1999.
To begin, In Museums and Galleries 37% people were visited which second highest collection of human beings in 1999. Moreover, only 16% manpower was come to see the historic houses and monuments of Britain. in the same year, the lowest percentage of visitors was in wildlife parks and zoos, up to just 9%.
Interestingly, the highest percentage of different kinds of tourist attraction in Britain was of theme parks which were up to 38percent. In theme parks sector, 47% people visited Blackpool pleasure beach. Apart from this, 17% and 16% of persons visited Alton Towers and pleasure land south port respectively. Then around 10 percent of tourists came to see Chessington world of adventures and Legoland Windsor in 1999 respectively.
Overall, It is immediately apparent from the chart that the theme parks sector was a most attractive place to visit for distinct tourists whereas wildlife parks and Zoos sector was on lower point for visitors in Britain till the end of the year 1999. The chart below shows the results of a survey of people who visited four The chart below shows the results of a survey of people who visited four
https://www.facebook.com/Ieltsdreamworld/
The chart below shows the results of a survey of people who visited four The chart below shows the results of a survey of people who visited four The chart below shows the results of a survey of people who visited four The chart below shows the results of a survey of people who visited four The chart below shows the results of a survey of people who visited four The chart below shows the results of a survey of people who visited four

Leave a Reply