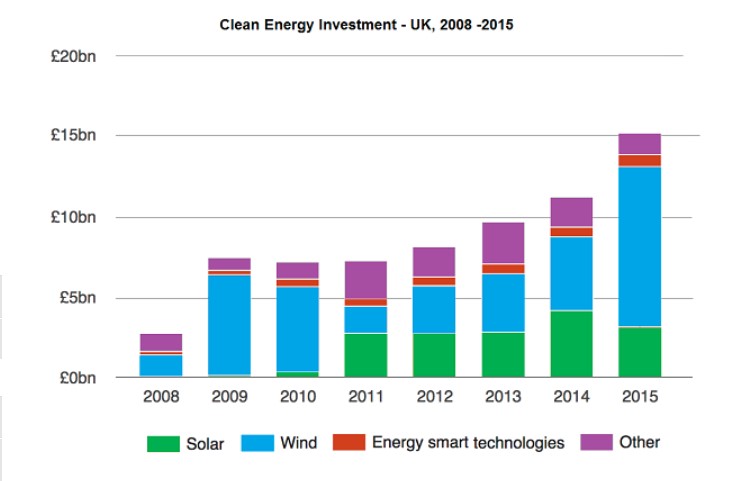
The graph below shows the amount of UK investments in clean energy from 2008 to 2015. Summarise the information by selecting and reporting the main features, and make comparisons where relevant.
The given bar graph is permission about the amount invested in a clean energy project in the United Kingdom from 2008 to 2015.
Overall, the investment ratio significantly increased while the lowest investment was made in 2008 and higher was in 2015.
To begin with, the UK clean energy project authority invested almost two and half billion in 2008 to generate eco-friendly power, which is half going to wind power and remaining another power sector the next is budget almost triple while small portion spent on smart energy Technology which is almost seven billion investments in 2009.
The figure remains the same for energy smart Technology till 2014 is a slight increase was recorded in 2015 which went as highest 15 billion.UK authorities’ investment in next two years. 2010 and 2011 remain alike, but more than 3rd was invested for solar power. Roughly 3 to 5 billion nearly spend to produce solar energy from 2012 to 2015. The UK has financed more on wind energy and secondly on solar energy and thirdly on the other form of energy, however the invested least amount on energy-smart technology.
Follow Us Our Facebook Page For Updates related to IELTS material
Also, Read In Some Countries 18 Is the Legal Age to Vote


Leave a Reply