The table below gives information on the proportion of carbohydrates, protein and fat in three different diets. Write a report for a university lecturer describing the information shown below. Make comparisons where relevant.
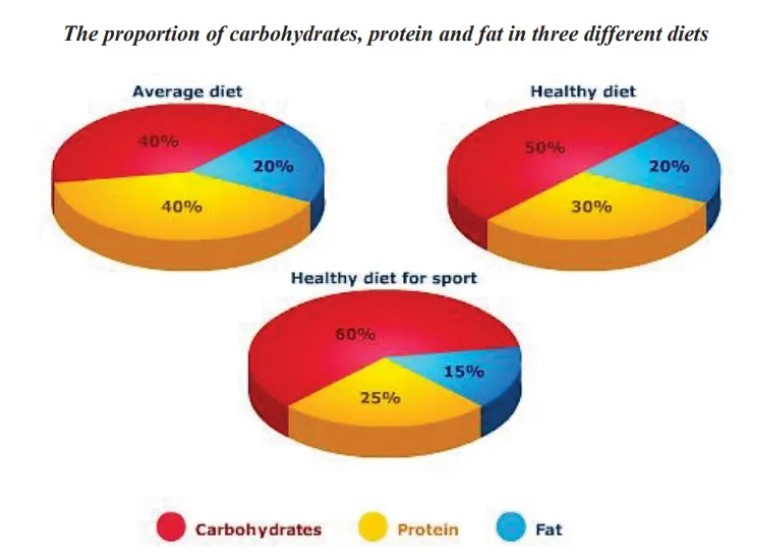
The pie charts illustrate the number of carbohydrates, protein and fat in three consecutive types of diets. An average diet contains 40% of carbohydrates and the same proportion of protein while the fat content is 20%.
The amount of carbohydrates is increased by 10% in a healthy diet, and the same is seen for fat; but for protein, it decreases by 10% compared to the average diet and more than the diet for sport.
The kind of diet that sports professionals follow contains a high amount of carbohydrates which reaches 60% of their total diet, and the amount of fat consumed by them is least at about 15%, which is the least among all three types of diets. At the same time, the protein content of their diet is 25%.
Overall it can be seen that the proportion of carbohydrates is maximum in all types of diets while the amount of protein and fat varies with the change in the kind of diet plan.
Follow Us Our Facebook Page For Updates related to IELTS material


Leave a Reply