
")
The table below gives information on UK acid rain emissions, measured in millions of tonnes, from four different sectors between 1990 and 2007. Write a report for a university lecturer describing the information shown below. Make comparisons where relevant.
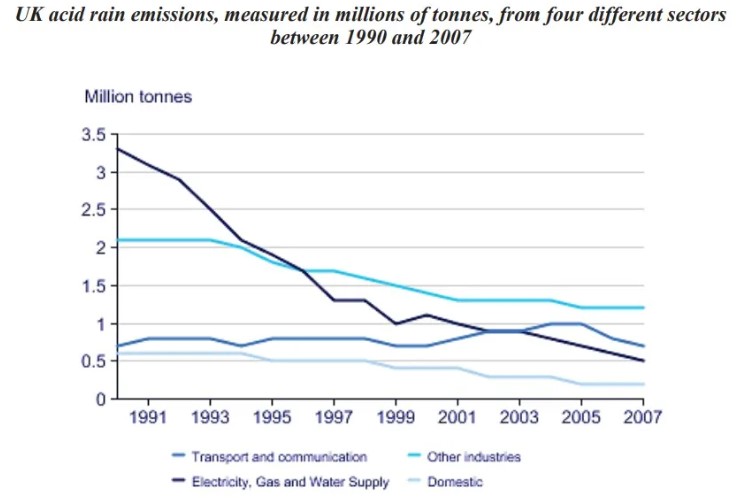
The line graph illustrates the discharge of acidic rain in the UK from 1990 to 2007 by four sectors. It is measured in a million tonnes. Overall, the electricity, gas and water supply sectors reported the most decline in the emission of polluted rain over the years.
Before 1991, the sector of basic needs such as gas, electricity and water emitted the highest acidic rainfall at about 3.3 million tonnes. Still, it constantly decreased till 1997 followed by fluctuations till 2003 and then settled at about 0.5 tonnes in 2007. At the same time, the domestic sector ejaculated the least amount of acid rain before 1991, which was about 0.6 tonnes. It also depicted a steady downfall and stayed at about 0.3 million tonnes in 2007.
Other industries were at 2.1 in the starting. It remained the same till 1993 followed by a downfall till 2007 at about 1.3 million tonnes. The transportation and communication sector was at 0.7 before 1991 in the third position in contributing to contaminated rain. It fluctuated till 2001 and increased to 1 in 2005 then declined to 0.6 in 2007.
Follow Us Our Facebook Page For Updates related to IELTS material
Leave a Reply