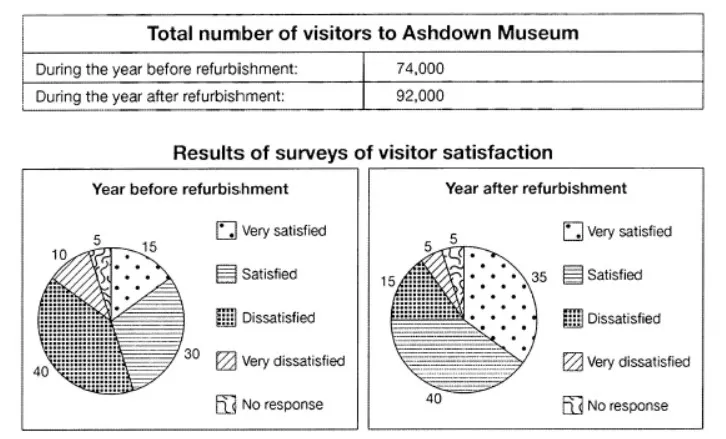
The table below shows the numbers of visitors to Ashdown Museum during the year before and the year after it was refurbished. The charts show the result of surveys asking visitors how satisfied they were with their visit, during the same two periods. Summarise the information by selecting and reporting the main features, and make comparisons where relevant.
Sample Answer of The Table Below Shows the Numbers of Visitors to Ashdown Museum
The table gives information about the number of people visited before and after renovation in the museum of Ashdown. Also, the piechart reveals the opinions poll of the people at that period.
Overall, it is clear from the glance that most of the guests visited after replenishment. Moreover, they were satisfied with the refurbishment.
As per the illustration, approximately 30,000 more people visited after the recreation. Notably, guests were fully satisfied with the change such it got over doubled than that of before. Earlier, exactly 30 per cent were satisfied, but there was a 10% increase after regeneracy. At the same time, the ratio of dissatisfied customers decreased from 40 to 15. Moreover, the survey of very dissatisfied percentage got exactly a half after the change. At last, the rest 5% of people gave non of the responses.
According to the survey, it is concluded that most of the people were happy with the reconstruction of the museum, and apparently increased the visitors.
Follow Us Our Facebook Page For Updates related to IELTS material
Also Read Talk about Something Interesting Your Friend Has Done but You Haven’t


Leave a Reply