
")
The chart below shows the amount of leisure time enjoyed by men and women of different employment statuses. Write a report for a university lecturer describing the information shown below.
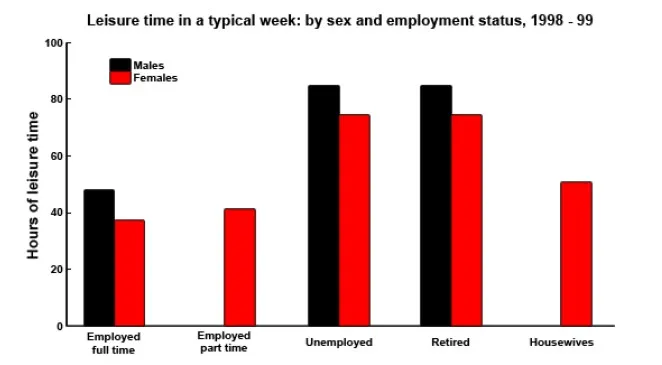
The information regarding the free time enjoyed by both genders based on their work status in a typical week from 1998 to 1999 is delineated by the vertical bar graph. The data has been calibrated in hours.
As a general analysis, it can be seen that unemployed and retired persons enjoyed the maximum spare time irrespective of their sex as compared to other people.
Having a glance at the chart, the males employed for the full time had approximately 48 leisure hours in an average week; while females had 10 hours less than the opposite sex of the same category. Surprisingly, there is no data given for part-time employed men; however, the figure of women got the same was around 40 hours. In the case of housewives, the leisure time was, more than employed females, accounted as almost 50 hours.
Probing ahead towards unemployed and retired people, they had precisely the same amount of leisure hours for the same gender. Interestingly, males and females had just above 80 and 70 hours of leisure time respectively in both categories.
Follow Us on IELTSFever Twitter
Also Read Crimes Rates amongst Younger People Have Been Rising
Leave a Reply