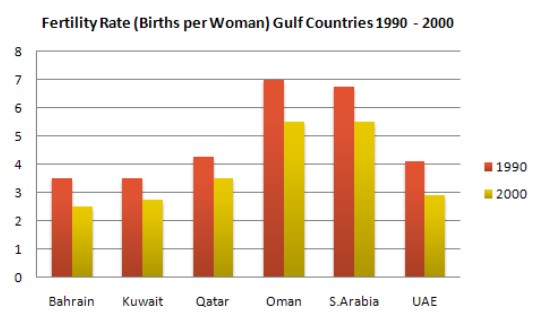
Write a report describing the Fertility Rate ( births per woman) in gulf countries between 1990 to 2000 in the graph below. You should write at least 150 words. You should spend about 20 minutes on this task.
The Bar chart illustrates the comparison of fertility rate in the women of six Gulf Countries between the years 1990 and 2000.
As a general overview, it is observed that the fertility rate has been decreased nearly by one number in the decade. Further, country-wise analysis shows that Oman and Saudi Arabia possess higher rates among the other four countries.
Now, if we look at each country’s data, the women of Bahrain had a fertility rate between 3 and 4 in the year 1990, whereas it decreased to less than 3 in the year 2020. Similarly, Kuwait had an indicator neat 3.5 that decreased to a slighter less than 3. Qatar had a rate above four, and that decreased to nearly 3.5. Oman, having the highest fertility rate among all Gulf Countries with a score of 7, sees most dip in the rate for 1.5 and in 2020 declined to 5.5. Following a similar trend, S. Arabia, with the second most high fertility rates, had a decline from a near under 7 to in between 5 and 6. The UAE also showed a similar trend as in 1990 it had a fertility rate just above the four that decreased to a little less to 3.
Follow Us Our Facebook Page For Updates related to IELTS material


Leave a Reply