

People Who Read for Pleasure Develop Their Imagination More
It is believed that people who read for pleasure develop their imagination more and acquire better language skills compared to people who prefer watching television. Read More
It is believed that people who read for pleasure develop their imagination more and acquire better language skills compared to people who prefer watching television. Read More
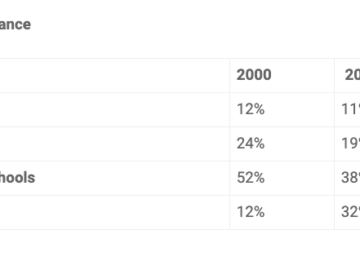
The table shows the Proportions of Pupils Attending Four Secondary School Types Between 2000 and 2009. Summarize the information by selecting and reporting the main Read More
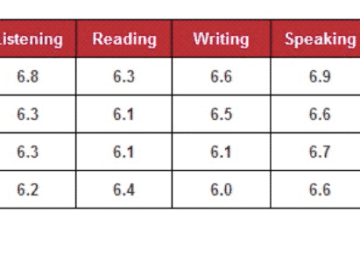
The table illustrates the breakdown of scores for the IELTS general test in 2010. The data has been calibrated in numbers. Sample Answer of illustrates Read More
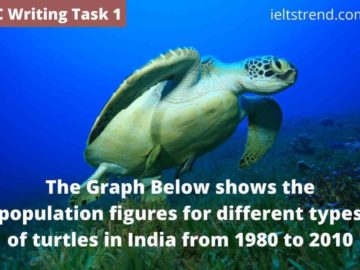
The Graph Below shows the population figures for different types of turtles in India from 1980 to 2010 You should spend about 20 minutes on this task. The Sample Read More