
 (1)")
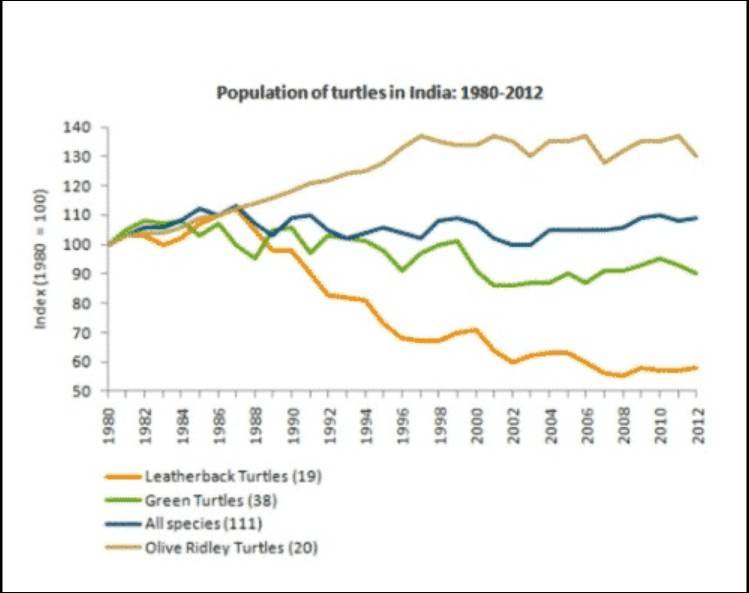
The Graph Below shows the population figures for different types of turtles in India from 1980 to 2010
You should spend about 20 minutes on this task.
The Sample Answer of The Graph Below shows the population figures for different types of turtles in India from 1980 to 2010
A glance at the graph provided reveals the information regarding the distinct turtle species namely, leatherback turtles, green turtles, all species and, lastly, olive ridley turtles, in India between 1980 and 2012.
Overall, the most striking feature is that olive ridley species was managed to increase their population whereas the leatherback turtles greatly reduced during the given tenure.
As is presented in the graph, there were 111 turtle species in India and turtle population index considered 100 units in 1980, all turtles were at unit 100. In the subsequent years, leatherback turtle’s number dropped significantly and reached to merely 60 units whereas the opposite trend was followed by the Olive Ridley turtles. This population continuously expanded, according to the index, till 1997 and then it after showing some fluctuations and finally it reached at the zenith point (120 units) till 2012. Green turtles showed the downward trend. The number of green turtles palpitated throughout the given
tenure and the population reached almost 95 in the year 1990. After that, its population was dropped and reached just below the 90 units in 2012. All species showed gradual increase till 1987 and following that reveals many ups and downs in the population.
A glance at the line graph provided reveals some striking similarities in the populace of turtles namely , leatherback turtles , green turtles , species and , lastly , olive ridley turtles during the period from 1980 to 2012.
Overall,the most striking feature is that the number of turtles species were remained stable throughtout the given tenure and all turtles species count were same in the first year.
Increasing from approximately 10% in 1982 to 35% in 1998, the populace of olive rudely turtle then show fluctuations till the last year and the rate was about 125% which was highest among all the turtles species . The same trend was followed by all species of turtle and green turtle with sustainable decline in the figure to somewhere in the vicinity of same as at starting point and 90% oderly. Moving further, a minimum increase had been observed in the rate of leatherback turtle in the year 1987 . Afterwards,a rapid fall can be seen and the populace of this turtle was almost 60%.