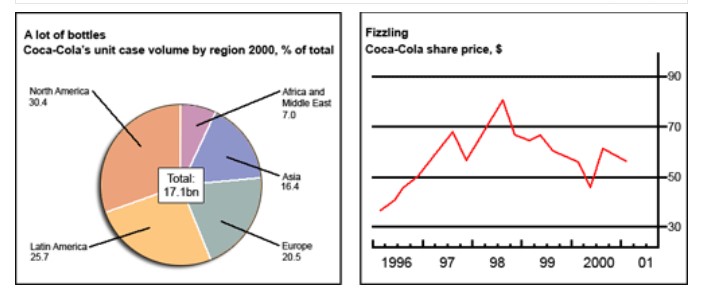
The chart and graph below give information about sales and share prices for Coca-Cola. Summarise the information by selecting and reporting the main features, and make comparisons where relevant.
 Sample Answer of The Chart and Graph Below Give Information About Sales and Share Prices for Coca-Cola
The rendered pie and line chart provides information regarding the selling and share price of coca-cola, i.e. soft drink brand.
Overall, 17.4 billion bottles were sold in different regions of the world for the year 2000. Secondly, fluctuations could be easily noticed in share price over the period of 1996 to 2000.
Firstly, North America acted as the largest segment that stands at providing 31% of the total. Sequentially, Latin America conquered second place with around 4.5 billion bottles. 20.5% and 16.4% were sold by Europe and Asia region respectively. Lastly, Africa and the Middle East contributed with 7% in all.
Following this, the Share price for 1996 was at nadir with about 33 dollars. A rise of almost 35 dollars could be observed from 1996 to 1997. Facing fluctuations, the share price went to zenith with approximately 80 dollars. For the year of 1999 till 2000 constant variation of seen, which ended at 53 dollars.
Follow Us Our Facebook Page For Updates related to IELTS material


Leave a Reply