
 (1)")
The graphs indicate the source of complaints about the bank of America and the amount of time it takes to have the complaints resolved. Summarise the information by selecting and report in the main features, and make comparisons where relevant. Write at least 150 words
Sample Answer of The Graphs Indicate the Source of Complaints About the Bank of America and The Amount of Time
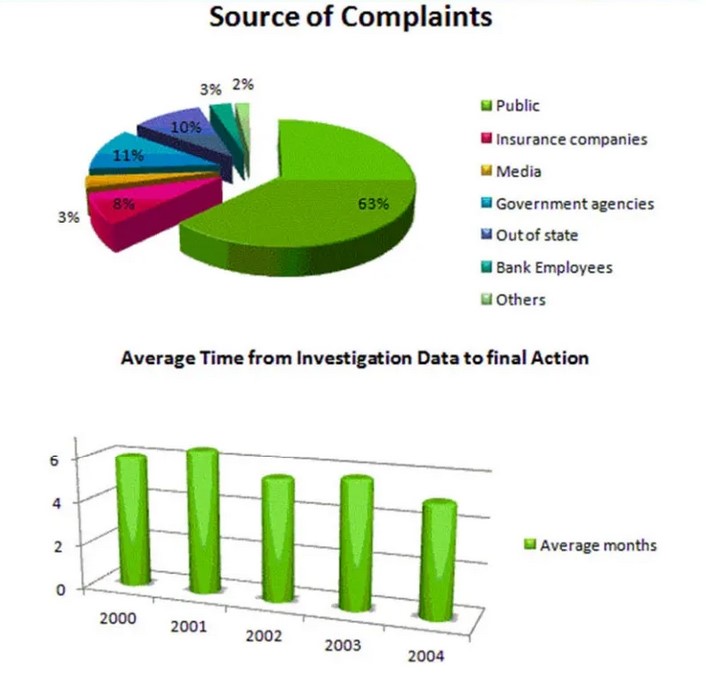
The provided pie chart illustrates the percentage of complaints of the bank of America from distinct sources while the bar graph demonstrates the proportion of time in which they resolved their complaints.
By taking a closer look at the first chart, it reveals that the public did the highest number of complaints about the bank of America and it was 63% whereas government agencies and out of state almost had the same amount of complaints (around 10%). However, the ratio of getting complaints from insurance companies was 8%. It is clearly seen that the figure of media, bank employees and others was least.
The second graph reveals that in the years 2000 and 2001, almost six months were taken to resolve the complaints of various sources while in the next 2 years, it took five months to investigate data. But in 2004, only four months were taken to solve the problems.
Overall, the main thing observed from the charts is that except public, other sources did not have more complaints.
Follow Us Our Facebook Page For Updates related to IELTS material
Leave a Reply