

The line chart shows average attendance at the cinema among various age groups in the US from 2000 to 2011. summarise the information by selecting and reporting the main features, and make comparisons where relevant.
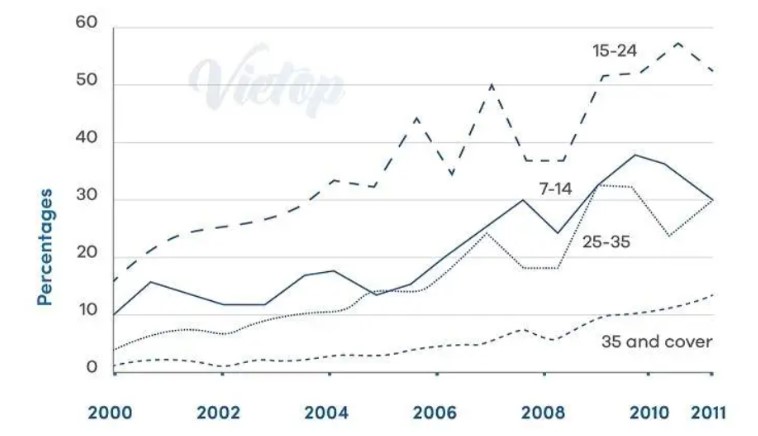
The line chart compares the attendance of cinema visitors among different age groups in the US from 2000 to 2011.
Overall it can be seen that the greatest passion for cinema was found among the age group 15 to 24. Also, there was an increase in the proportion of average cinema attendance among all the given age groups.
In 2000, the percentage of yearly cinema attendance was 18% among 15-24 age groups, followed by 7-14 at 10%, while it was only a meagre 4% and 2% respectively in 25-35 and 35 plus age groups. There was more than a 10% increase in the presence of 15-24age groups. However, slight fluctuations were observed among the remaining categories of people, and their figures rose to reach 18%,10% and 3%.
There was a significant increase in the proportion of people who attended movies from the year 2004. Teenagers’ presence in the age group 15-24 who went to cinema rose with fluctuations to reach a peak at nearly 60% by the end of the given period. Similarly,7-14, and 24-35 age groups attendance gradually increased with slight variations and their figures were same at 30% in the year 2011, whereas it was only a meagre 2% in the eldest age groups.
Follow Us Our Facebook Page For Updates related to IELTS material
Leave a Reply