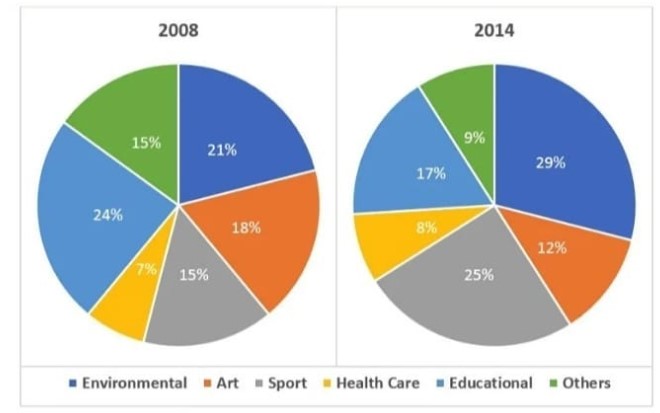
The chart below shows the percentage of volunteers by organisations in 2008 and 2014
Sample Answer of The Chart Below Shows the Percentage of Volunteers by Organisations in 2008 and 2014
The pie chart details the proportions of volunteers by organisations in 6 different fields in 2008 and 2014. From an overall perspective, it is readily apparent that the vast majority of volunteers engaged in environment and educational activities, while healthcare was the lowest in both years.
Looking more specifically, the proportion of people who took part in educational activities was highest at 24% in 2008, followed closely by
the figures for environmental and art, which were 21% and 18%, respectively. By 2014, the percentage of individuals participating in educational campaigns had decreased to 17%, whereas the data for art declined slightly from 18% to 12%. In contrast, the percentage of
volunteers that did environmental projects increased by 8%, becoming the highest number.
Turning to the remaining categories, the figures for sport and others had the same percentage, 15%, while healthcare was much lower, at 7%. In 2014, there was a 10% increase in people playing a sport, whereas the proportion of those who did other activities fell by 6%, accounting for just 9%. The data of healthcare rose by only 1% at the end of the period.
Follow Us Our Facebook Page For Updates related to IELTS material.


Leave a Reply