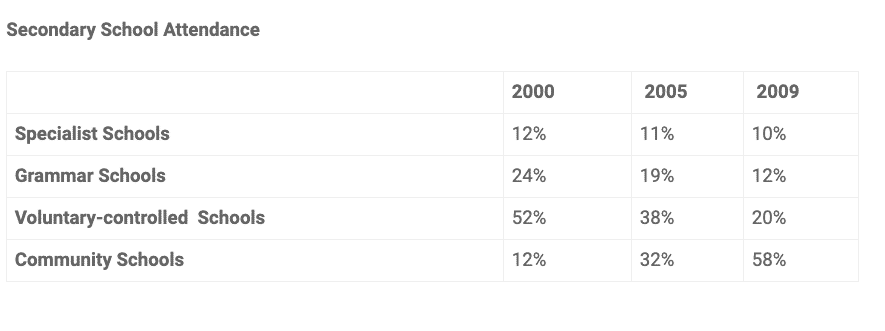
The table shows the Proportions of Pupils Attending Four Secondary School Types Between 2000 and 2009.
Summarize the information by selecting and reporting the main features and make comparisons where relevant.
Sample Answer of The table shows the Proportions of Pupils Attending Four Secondary School Types Between 2000 and 2009.
A glance at the spreadsheet provided reveals the percentage of learners who attended different kinds of secondary schools namely, specialist schools, grammar schools, voluntary–controlled schools, and, lastly, community schools in the year 2000, 2005 and 2009.
Overall, the most striking feature is that a fluctuation had been observed in the attendance of secondary school pupils in the stipulated period. It is evident from the tabular chart in the initial year, the count of children who attended specialist school was just above the one-tenth of the whole proportion. After 5 years the rate of pupils was the same as at the beginning of the year but in 2009 the count was 10%. Moreover, the interest of scholars was dramatically decreased, with the passage of time from almost a quarter to 12%.
Follow Us on IELTSDream Facebook Page
Moving further, 52% and merely 38% of pupils went to schools that were voluntary – controlled in the year 2000 and 2005 respectively. Afterward, the rate was dropped to approximately doubled, if compared with the latter one. The proportion of students who attended community schools were significantly increased from 12% to 58% in the last given tenure.


Leave a Reply