
")
The bar chart below shows the average duration of housework women did (unemployed, part-time employed, and full-time) when compared to men who had full-time work in the UK between 1985 and 2005. Summarise the information by selecting and reporting the main features, and make comparisons where relevant.
The graph illustrates the average time of household chores three categories of females did, i.e., full-time housewives, partly employed and full time in comparison to males who work around the clock in the UK from 1985 to 2005.
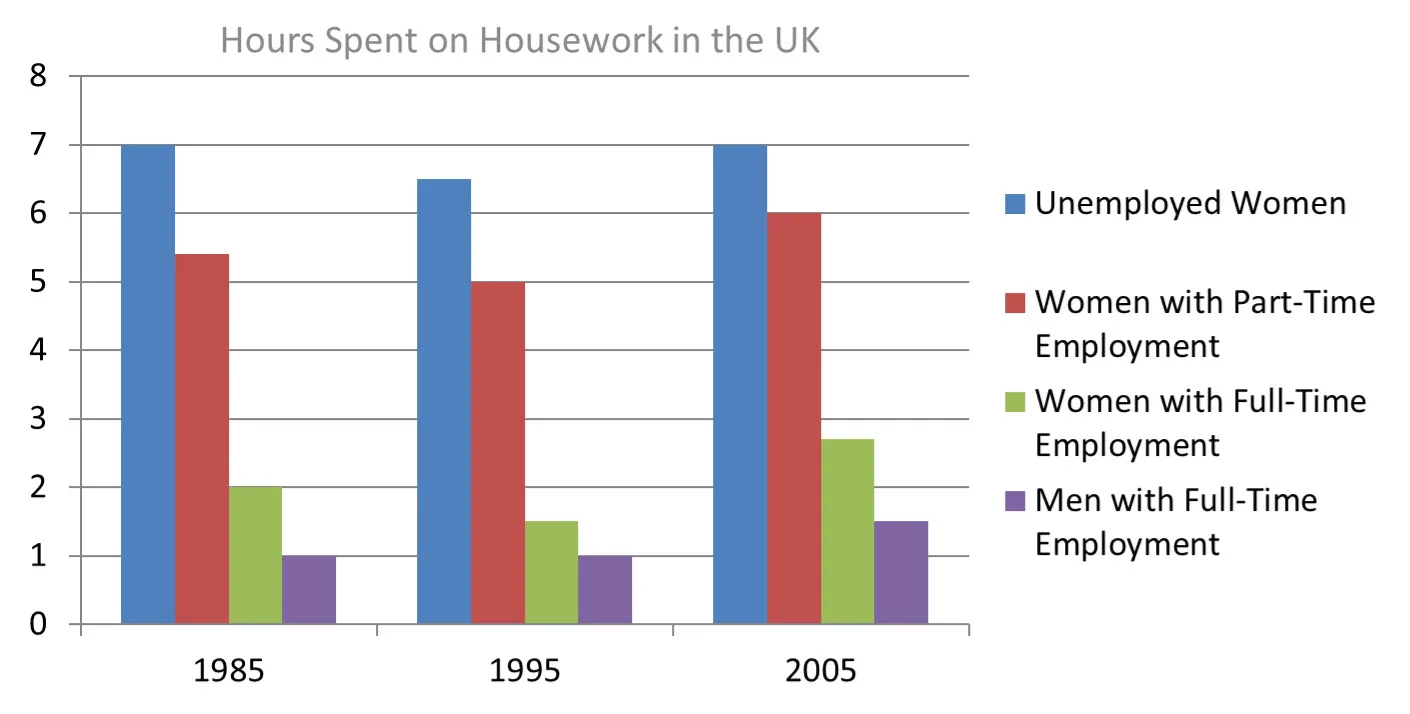
Unemployed women spent the highest number of hours doing household chores followed by partly employed, with fully working taking the third position and employed males on the last position. All the four categories had an increase in hours spent in 2005 as compared to 1985.
Women who stayed at home spent 7 hours on average, doing housework in 1985 which fell slightly to almost 6.5 hours in 1995 before rising back to 7 hours in 2005. In 1985 partly working women carried out their home duties for 6.5 hours then fell to 6 hours in 1995 then rose to 7 hours in 2005.
Full-time working females had fewer hours spent on household work with only an average of 2 hours from 1985 to 1995 and 3 hours in 2005. Men who go to work only did housework for one hour for the first decade and 1.5 hours for 2005.
Also read: The Table Beneath Shows the Level of People Specialists in Various Kinds of Enterprises
Follow Us Our Facebook Page For Updates related to IELTS material
Leave a Reply