

The chart below gives information about global sales of games software, CDs and DVD or video. Write a report for a university lecturer describing the information.
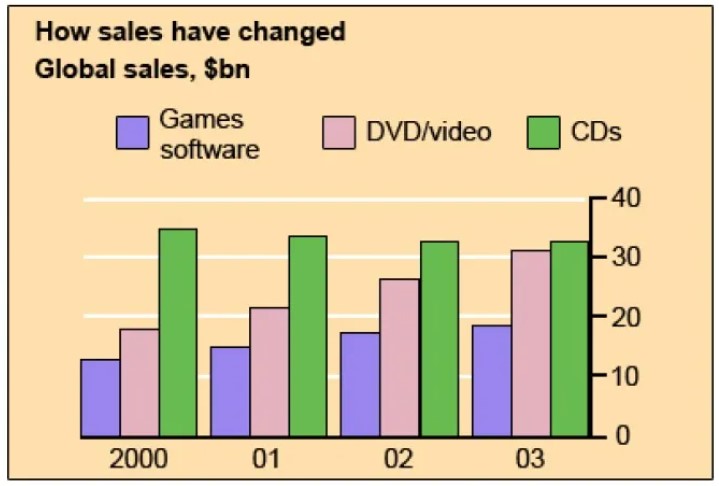
The given bar chart depicts the world sales of three different categories: games software, CDs and DVDs or video in four individual years 2000,2001,2002,2003. The data is Callobroted in billions.
In the year 2000, the sales of CDs were 35 billion dollars. In the same year, the sales amount of DVDs and games software were less than 20 billion. Moreover, in 2001, there was a slight increment in the two sectors DVD and games software about 20 and 15 billion respectively.
Whereas there was a sharp drop in CDs, approximately 34 billion. In the year 2002, the same trend was seen in 2001. There was a dramatic surge in DVDs in the final year, about more than 30 billion. Whilst, there was little drop in CDs around two billion.
To sum up, it is evident that, there were slightly inclined throughout the year. Nevertheless, there were the highest amount of sales in all given years, Evan, it sharply dropped throughout the year.
Follow Us Our Facebook Page For Updates related to IELTS material
Leave a Reply