
")
The chart below shows how much money is spent in the budget on different sectors by the UAE government in 2000. Summarize the information by selecting and reporting the main features, and make comparisons where relevant
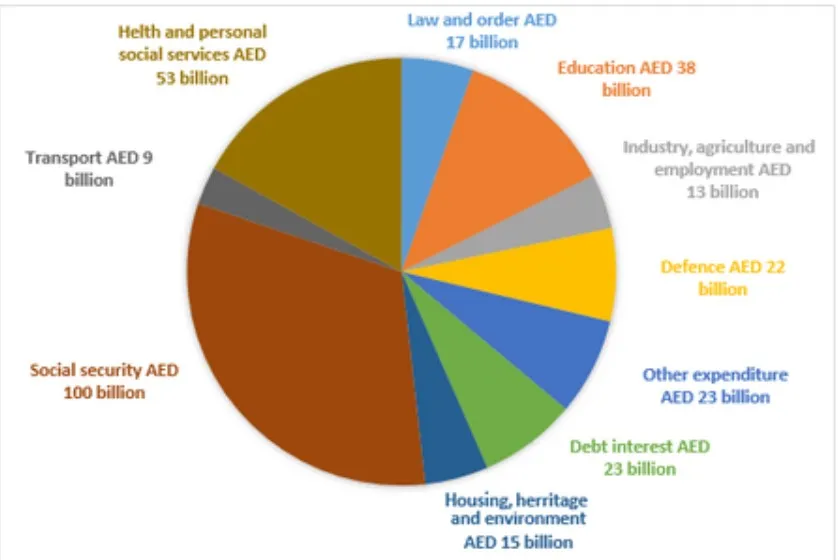
The above pie chart showcases the budget spent on different areas by the UAE administration in the year 2000. As per the data, the total budget was 313 billion dollars which were distributed among various sectors.
We can see that near around one-third budget was spent on social security, which was followed by health and personal social services, which was around 16% of the total budget spent. The social security budget was nearly six-time to that of law and order and nearly eight times to the industrial, agriculture and employment Budget.
Above all the social security occupied the maximum area in the, i.e. chart around 100 billion dollars which then chased by health and personal social service sector which accounts for 53 billion dollars. The budget of other expenditure and debt interest was nearly same at 23 Billion dollars whereas education & law and order budget stands at 38 and 17 billion dollars respectively. Out of all these, the least budget was grabbed by the transport industry, which was around 9 billion dollars.
Also read:The Chart below Shows the Percentage of Young People in Higher Education
Follow Us Our Facebook Page For Updates related to IELTS material
Leave a Reply