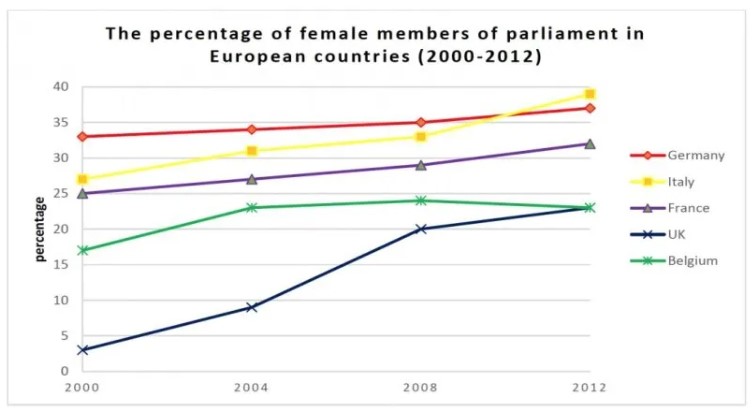
The chart below shows the percentage of female members of parliament in 5 European countries from 2000 to 2012. Summarize the information by selecting and reporting the main features, and making comparisons where relevant.
The chart illustrates the percentage of female members of parliament in 5 European countries from the year 2000 to the year 2012.
The chart shows Germany had between 33 to 37% of female members from 2000 to 2012, while France had between 25 to about 32% of female members between 2000 to 2012. Both countries experienced only a slight increase in the percentage of female members over the 12 years (about 4% and 7% respectively).
Belgium is shown to have had about 17% of female members in the year 2000 while the UK had the lowest of all at about 2.5% of female members, experiencing a significant rise to meet France at about 22.5% of female members by the year 2012.
Italy had about 17% of female members in the year 2000, rising steadily to surpass Germany by the year 2012 with almost 40% of female members.
Overall, Italy had the highest percentage of female members at about 40% in 2012, while France and the UK had the lowest percentage at about 22.5% in the same year. Italy and Germany had about 36% of female members around 2010.
Follow Us Our Facebook Page For Updates related to IELTS material


Leave a Reply