
 (1)")
The charts below show the main reasons for study among students of different age groups and the amount of support they received from employers. Summarise the information by selecting and reporting the main features, and make comparisons where relevant.
 Sample Answer of The Charts Below Show the Main Reasons for Study Among Students of Different Age Groups
The column graph representation reveals the purpose of education by distinct age groups and the proportion of members who got support from the employers.
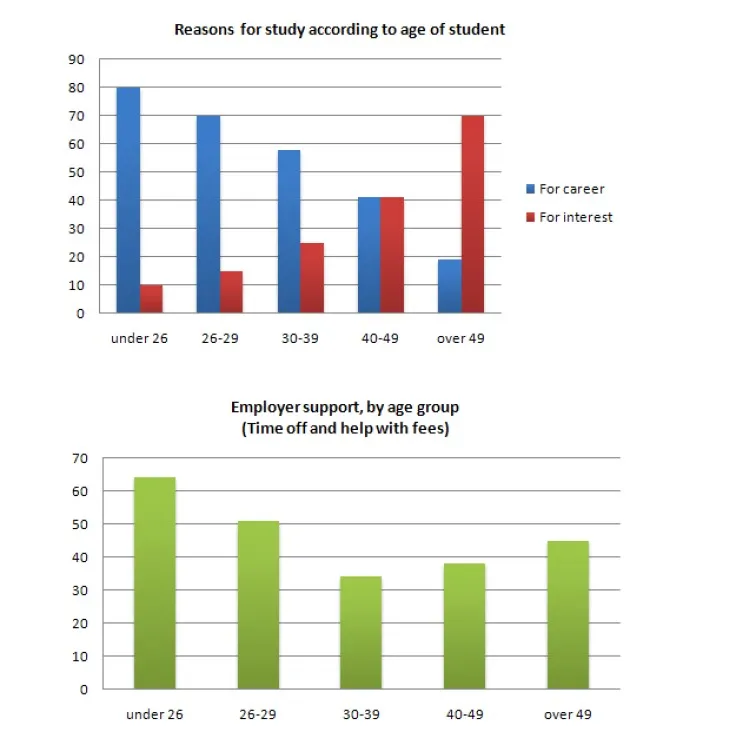
Overall, it is clear from the graph that the people under age group 26, career was the reason for the study whereas over 49-year-old people gave importance to their interest. Moreover, freshers got maximum support from elders among all age groups.
As per the illustration, exact 80% of people up to 26 years old studied for the job and gave least (10%) importance to interest. The career ratio decreases significantly by 10 % up to 39 years old, while the interest ratio is approximately half of it. The 40- 49 years old, reasons were same, which are 40%. At last, over 49 age group over three- quarter of people found interest as a reason for study which was apparently the highest while career interest was least.
Over 60 % of the employer’s supported the age group under 26, and exactly a half helped 26- 29 years old. The rest of the age group proportion hovered under 50%. The least (35%) support was given to below 39 years old. The supporters rose slightly for the rest of the age group.
Leave a Reply