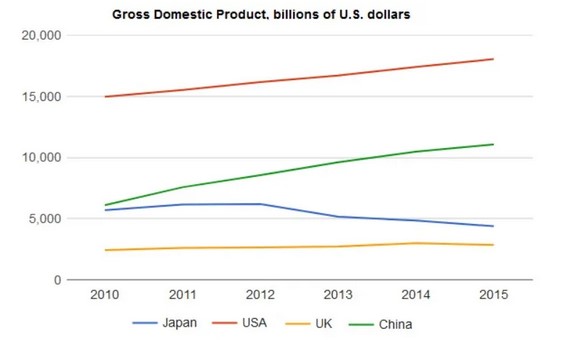
The graph below shows the Gross Domestic Products (GDP) in four selected countries between 2010 and 2015. Summarize the information by selecting and reporting the main features, and make comparisons where relevant.
 Sample Answer of The Graph Below Shows the Gross Domestic Products (GDP) in Four Selected Countries Between 2010 and 2015
The figure shown is a representation of the Gross Domestic Product (GDP) of four countries, namely: Japan, USA, United Kingdom and China, for the period 2010 to 2015.
The GDP for the UK for the said period was in the range of $2500 billion to $3000 billion in 2010 & 2015, respectively. This represented a marginal increase of about $500 billion within a space of 5 years, and the UK, out of the four countries represented, also recorded the lowest GDP. Japan within the same period had a GDP of approximately $6000 billion, which slid to about $4000 billion from 2010 to 2015. This showed a drop of about $2000 billion within the period under review. This made Japan be the only country out of the four represented to have a negative gradient in the pattern of GDP attained from 2010 to 2015. China, on the other hand, had about $6500 billion in 2010 and then about $11000 billion in 2015. This illustrated a sharp rise of nearly 100%. The USA in 2010 recorded a GDP of $15000 billion and in 2015 had a GDP of about $18000 billion, making it the country with the highest GDP among the four nations. Within the said period USA GDP also rose by $3000 billion, which was quite remarkable.
Comparing the GDPs of the four nations, it stands out clearly that the UK had the least GDP while managing to attain a marginal increment within the period. Japan is the only country of the four that failed to have a rise in GDP within the period but rather had a decrease of about $2000 billion in GDP, indicating a negative economic performance for that country within the period. China notably had the highest growth by recording in 2015 almost twice the GDP it had in 2010. This sharp rise in GDP is apparently indicative of a tremendous economic performance. The USA as of 2010 had the highest among the four countries in 2010 and also in 2015.
In conclusion, the representation of the GDP of the four nations gives a rough idea of the general performance of their respective economies, which in essence translates to how likely the individuals and groups residing in these countries would have fared in their various socio-economic lives. It also gives a rough idea of how well the national economies have been managed by governmental and nongovernmental functionaries at different levels and sectors of their economies.
Also Read Crimes Rates amongst Younger People Have Been Rising
Follow Us Our Facebook Page For Updates related to IELTS material


Leave a Reply