
 (1)")
The graph below shows the average monthly use of health clubs in Miami and Florida by all full-time members in 2017. The pie charts show the age profile of male and female members of this health club. Summarise the information by selecting and reporting the main features, and make comparisons where relevant.
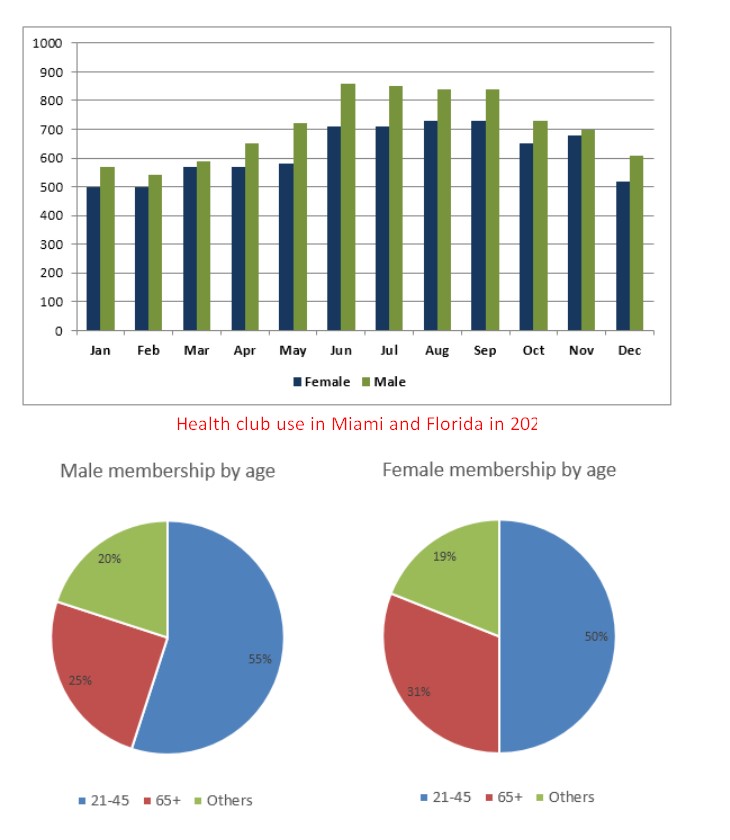
The graph illustrates the 2017 report of monthly utilization of health clubs by permanent members in both Miami and Florida, while the pie charts demonstrate the age description of both genders attending the club. Overall, the number of male members is higher than the females, with a higher percentage of both sexes being young adults.
It is observed on the graph that there was an increase in the use of health clubs by men starting off at 580 members in January, reached its peak in June with 850 members and reduced slightly to 600 in December. Women, however, saw an unstable pattern with 500 members in January. It thereafter experienced a constant value on several occasions before it finally reduced to 500 members in December.
The pie charts revealed that almost the average of the members using these health clubs was a young adult (21-45 years) with the male at 55% and female at 50%. Also, women in the age group of 65 and above had a higher attendance compared to their male counterparts, with their percentages at 31% and 25%, respectively. It is also noted that other age groups recorded lower attendance.
Follow Us Our Facebook Page For Updates related to IELTS material
Also, Read Some Countries Have Introduced Laws to Limit Working Hours
Leave a Reply