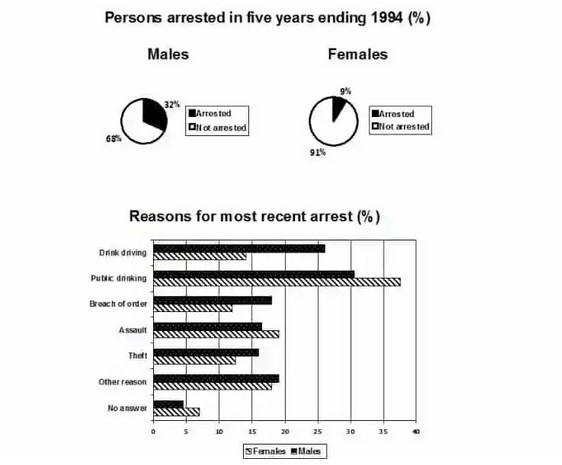
The pie chart shows the percentage of persons arrested in the five years ending 1994 and the bar chart shows the most recent reasons for arrest. Summarize the information by selecting and reporting the main features and making comparisons where relevant.
The pie chart illustrates the percentage of males and females arrested in the five years ending 1994, whereas the bar graph describes the percentage of the reason for people arrested.
Overall, it can be said that females were less arrested as compared to males. The most common reason for arresting people was public drinking.
Getting back to the details, 32% of males were arrested, while 9% of females were arrested in the five years ending 1994. In the case of drink driving, roughly 14% of females were arrested, while little more than 25% of males were arrested. But these percentages increased slightly for the reason of public drinking. Approximately 32%males and around 35% of females were arrested. Males arrested for breach of order accounted for little more than 15 per cent, and for females, there was a slight decrease.
Moving ahead, The reason of males arrested made up16% for assault and 15% for theft, whilst the percentage of females arrested were high in assault and less in theft as compared with males. For the other reason, approx. 18% were males arrested, and roughly 16% were females arrested. Around 5% of males and females were arrested for the reason of no answer.
Follow Us Our Facebook Page For Updates related to IELTS material


Leave a Reply